| Zacks Company Profile for W.P. Carey Inc. (WPC : NYSE) |
|
|
| |
| • Company Description |
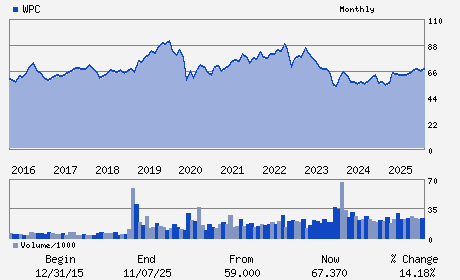
| W. P. Carey Inc. is a real estate investment trust engaged in providing long-term sale-leaseback and build-to-suit financing for companies. The firm primarily invests in commercial properties that are generally triple-net leased to single corporate tenants including office, warehouse, industrial, logistics, retail, hotel, R&D, and self-storage properties. W. P. Carey Inc., formerly known as W. P. Carey & Co. LLC, is based in New York.
Number of Employees: 199 |
|
|
| |
| • Price / Volume Information |
| Yesterday's Closing Price: $74.48 |
Daily Weekly Monthly
 |
| 20 Day Moving Average: 1,257,738 shares |
| Shares Outstanding: 222.74 (millions) |
| Market Capitalization: $16,589.60 (millions) |
| Beta: 0.77 |
| 52 Week High: $75.69 |
| 52 Week Low: $60.02 |
| Short Interest Ratio: |
| |
% Price Change |
% Price Change Relative to S&P 500 |
| 4 Week |
1.03% |
-3.90% |
| 12 Week |
0.31% |
-7.27% |
| Year To Date |
15.72% |
7.00% |
|
|
|
|
| |
| • Address & Contact Information |
| Street Address |
Phone / Fax |
Email Address |
Web URL |
ONE MANHATTAN WEST 395 9TH AVENUE 58TH FLOOR
-
NEW YORK,NY 10001
USA |
ph: 212-492-1100
fax: 212-492-8922 |
ir@wpcarey.com |
http://www.wpcarey.com |
|
|
| |
| • General Corporate Information |
Officers
Jason E. Fox - Chief Executive Officer and Director
Christopher J. Niehaus - Chairman and Director
ToniAnn Sanzone - Chief Financial Officer
Brian Zander - Chief Accounting Officer
Constantin H. Beier - Director
|
|
Peer Information
W.P. Carey Inc. (ARE)
W.P. Carey Inc. (CUZ)
W.P. Carey Inc. (FUR)
W.P. Carey Inc. (NNN)
W.P. Carey Inc. (FCH)
W.P. Carey Inc. (CTO)
|
|
Industry / Sector / Ticker Info
Analyst Coverage: No
Industry Group: REIT-EQTY TRUST -OTHER
Sector: Finance
CUSIP: 92936U109
SIC: 6798
|
|
Fiscal Year
Fiscal Year End: December
Last Reported Quarter: 03/01/26
Next Expected EPS Date: 08/04/26
|
|
Share - Related Items
Shares Outstanding: 222.74
Most Recent Split Date: (:1)
Beta: 0.77
Market Capitalization: $16,589.60 (millions)
|
|
|
|
|
| |
| • EPS Information |
• Dividend Information |
| Analyst Coverage: No |
Dividend Yield: 4.99% |
| Current Fiscal Quarter EPS Consensus Estimate: $1.26 |
Indicated Annual Dividend: $3.72 |
| Current Fiscal Year EPS Consensus Estimate: $5.02 |
Payout Ratio: 0.73 |
| Number of Estimates in the Fiscal Year Consensus: 2.00 |
Change In Payout Ratio: -0.05 |
| Estmated Long-Term EPS Growth Rate: 4.64% |
Last Dividend Paid: 03/31/2026 - $0.93 |
| Next EPS Report Date: 08/04/26 |
|
|
|
| |