| Zacks Company Profile for Xenia Hotels & Resorts, Inc. (XHR : NYSE) |
|
|
| |
| • Company Description |
| Xenia Hotels & Resorts, Inc. is a self-advised and self-administered REIT. The company invests primarily in premium full service, lifestyle, urban upscale hotels, lodging markets as well as leisure destinations primarily in the United States. Xenia Hotels & Resorts, Inc. is based in Orlando, Florida.
Number of Employees: 42 |
|
|
| |
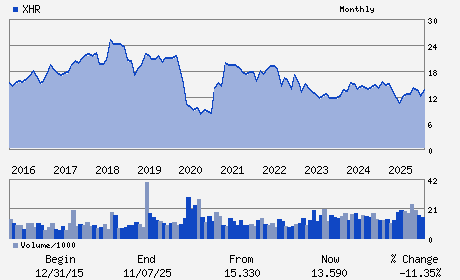
| • Price / Volume Information |
| Yesterday's Closing Price: $16.82 |
Daily Weekly Monthly
 |
| 20 Day Moving Average: 771,271 shares |
| Shares Outstanding: 92.25 (millions) |
| Market Capitalization: $1,551.58 (millions) |
| Beta: 1.17 |
| 52 Week High: $17.23 |
| 52 Week Low: $11.34 |
| Short Interest Ratio: |
| |
% Price Change |
% Price Change Relative to S&P 500 |
| 4 Week |
4.54% |
-0.57% |
| 12 Week |
5.32% |
-2.63% |
| Year To Date |
18.95% |
10.01% |
|
|
|
|
| |
| • Address & Contact Information |
| Street Address |
Phone / Fax |
Email Address |
Web URL |
200 S. ORANGE AVENUE SUITE 2700
-
ORLANDO,FL 32801
USA |
ph: 407-246-8100
fax: 866-748-7101 |
None |
http://www.xeniareit.com |
|
|
| |
| • General Corporate Information |
Officers
Marcel Verbaas - Chair and Chief Executive Officer
Barry A.N. Bloom - President and Chief Operating Officer
Atish Shah - Executive Vice President; Chief Financial Officer
Joseph T. Johnson - Senior Vice President and Chief Accounting Officer
Keith E. Bass - Director
|
|
Peer Information
Xenia Hotels & Resorts, Inc. (ARE)
Xenia Hotels & Resorts, Inc. (CUZ)
Xenia Hotels & Resorts, Inc. (FUR)
Xenia Hotels & Resorts, Inc. (NNN)
Xenia Hotels & Resorts, Inc. (FCH)
Xenia Hotels & Resorts, Inc. (CTO)
|
|
Industry / Sector / Ticker Info
Analyst Coverage: No
Industry Group: REIT-EQTY TRUST -OTHER
Sector: Finance
CUSIP: 984017103
SIC: 7011
|
|
Fiscal Year
Fiscal Year End: December
Last Reported Quarter: 03/01/26
Next Expected EPS Date: 08/07/26
|
|
Share - Related Items
Shares Outstanding: 92.25
Most Recent Split Date: (:1)
Beta: 1.17
Market Capitalization: $1,551.58 (millions)
|
|
|
|
|
| |
| • EPS Information |
• Dividend Information |
| Analyst Coverage: No |
Dividend Yield: 3.33% |
| Current Fiscal Quarter EPS Consensus Estimate: $ |
Indicated Annual Dividend: $0.56 |
| Current Fiscal Year EPS Consensus Estimate: $1.81 |
Payout Ratio: 0.30 |
| Number of Estimates in the Fiscal Year Consensus: 1.00 |
Change In Payout Ratio: 0.06 |
| Estmated Long-Term EPS Growth Rate: % |
Last Dividend Paid: 03/31/2026 - $0.14 |
| Next EPS Report Date: 08/07/26 |
|
|
|
| |