| Zacks Company Profile for XPLR Infrastructure, LP (XIFR : NYSE) |
|
|
| |
| • Company Description |
| XPLR Infrastructure LP is a limited partnership which owns clean energy infrastructure assets with a focus on contracted renewable energy projects. XPLR Infrastructure LP, formerly known as NextEra Energy Partners LP, is headquartered in Juno Beach, Florida.
Number of Employees: |
|
|
| |
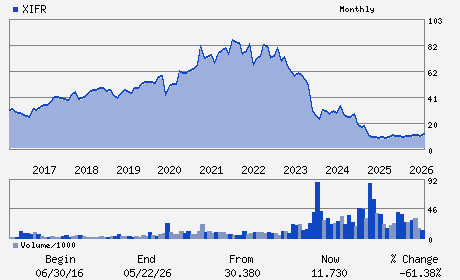
| • Price / Volume Information |
| Yesterday's Closing Price: $11.73 |
Daily Weekly Monthly
 |
| 20 Day Moving Average: 1,381,926 shares |
| Shares Outstanding: 94.27 (millions) |
| Market Capitalization: $1,105.82 (millions) |
| Beta: 0.89 |
| 52 Week High: $12.61 |
| 52 Week Low: $7.99 |
| Short Interest Ratio: |
| |
% Price Change |
% Price Change Relative to S&P 500 |
| 4 Week |
18.13% |
12.36% |
| 12 Week |
10.35% |
2.01% |
| Year To Date |
17.30% |
7.66% |
|
|
|
|
| |
|
|
| |
| • General Corporate Information |
Officers
S. Alan Liu - President and Chief Executive Officer
John W. Ketchum - Chairman
Jessica Geoffroy - Chief Financial Officer
William J. Gough - Controller
Michael H. Dunne - Director
|
|
Peer Information
XPLR Infrastructure, LP (APWR)
XPLR Infrastructure, LP (USFCQ)
XPLR Infrastructure, LP (SGII.)
XPLR Infrastructure, LP (APGI)
XPLR Infrastructure, LP (HYDP)
XPLR Infrastructure, LP (FCEL)
|
|
Industry / Sector / Ticker Info
Analyst Coverage: No
Industry Group: Other Alt Energy
Sector: Oils/Energy
CUSIP: 65341B106
SIC: 4911
|
|
Fiscal Year
Fiscal Year End: December
Last Reported Quarter: 03/01/26
Next Expected EPS Date: 08/06/26
|
|
Share - Related Items
Shares Outstanding: 94.27
Most Recent Split Date: (:1)
Beta: 0.89
Market Capitalization: $1,105.82 (millions)
|
|
|
|
|
| |
| • EPS Information |
• Dividend Information |
| Analyst Coverage: No |
Dividend Yield: 0.00% |
| Current Fiscal Quarter EPS Consensus Estimate: $-0.50 |
Indicated Annual Dividend: $0.00 |
| Current Fiscal Year EPS Consensus Estimate: $-0.31 |
Payout Ratio: 0.00 |
| Number of Estimates in the Fiscal Year Consensus: 2.00 |
Change In Payout Ratio: -1.59 |
| Estmated Long-Term EPS Growth Rate: % |
Last Dividend Paid: NA - $0.00 |
| Next EPS Report Date: 08/06/26 |
|
|
|
| |