| Zacks Company Profile for XPO, Inc. (XPO : NYSE) |
|
|
| |
| • Company Description |
| XPO Inc. is a provider of asset-based less-than-truckload transportation principally in North America, with proprietary technology which moves goods efficiently. XPO Inc., formerly known as XPO LOGISTICS, is headquartered in Greenwich, Conn.
Number of Employees: 37,000 |
|
|
| |
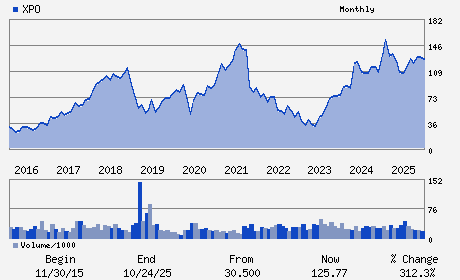
| • Price / Volume Information |
| Yesterday's Closing Price: $202.92 |
Daily Weekly Monthly
 |
| 20 Day Moving Average: 1,386,638 shares |
| Shares Outstanding: 117.41 (millions) |
| Market Capitalization: $23,824.84 (millions) |
| Beta: 1.87 |
| 52 Week High: $231.46 |
| 52 Week Low: $110.78 |
| Short Interest Ratio: |
| |
% Price Change |
% Price Change Relative to S&P 500 |
| 4 Week |
-9.72% |
-14.13% |
| 12 Week |
-1.08% |
-8.55% |
| Year To Date |
49.30% |
37.71% |
|
|
|
|
| |
| • Address & Contact Information |
| Street Address |
Phone / Fax |
Email Address |
Web URL |
5 AMERICAN LANE
-
GREENWICH,CT 06831
USA |
ph: 855-976-6951
fax: 269-695-7458 |
investors@xpo.com |
http://www.xpo.com |
|
|
| |
| • General Corporate Information |
Officers
Mario Harik - Chairman and Chief Executive Officer
Allison Landry - Vice Chair of the Board of Directors
Kyle Wismans - Chief Financial Officer
Christopher Brown - Chief Accounting Officer
Bella Allaire - Director
|
|
Peer Information
XPO, Inc. (DMSC)
XPO, Inc. (CVLG)
XPO, Inc. (IRNE)
XPO, Inc. (CDV)
XPO, Inc. (ARCB)
XPO, Inc. (CEXP)
|
|
Industry / Sector / Ticker Info
Analyst Coverage: No
Industry Group: TRANS-TRUCK
Sector: Transportation
CUSIP: 983793100
SIC: 4700
|
|
Fiscal Year
Fiscal Year End: December
Last Reported Quarter: 03/01/26
Next Expected EPS Date: 07/30/26
|
|
Share - Related Items
Shares Outstanding: 117.41
Most Recent Split Date: 9.00 (0.25:1)
Beta: 1.87
Market Capitalization: $23,824.84 (millions)
|
|
|
|
|
| |
| • EPS Information |
• Dividend Information |
| Analyst Coverage: No |
Dividend Yield: 0.00% |
| Current Fiscal Quarter EPS Consensus Estimate: $1.43 |
Indicated Annual Dividend: $0.00 |
| Current Fiscal Year EPS Consensus Estimate: $4.84 |
Payout Ratio: 0.00 |
| Number of Estimates in the Fiscal Year Consensus: 10.00 |
Change In Payout Ratio: 0.00 |
| Estmated Long-Term EPS Growth Rate: 17.64% |
Last Dividend Paid: NA - $0.00 |
| Next EPS Report Date: 07/30/26 |
|
|
|
| |