| Zacks Company Profile for Xtant Medical Holdings, Inc. (XTNT : AMEX) |
|
|
| |
| • Company Description |
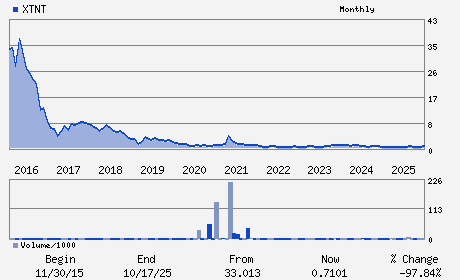
| Xtant Medical Holdings, Inc. develops, manufactures and markets biologics products. The Company's product used in an applications which includes enhancing fusion in spine surgery, relief of back pain, promotion of bone growth in foot and ankle surgery, promotion of cranial healing following neurosurgery and subchondral repair in knee and other joint surgeries. Xtant Medical Holdings, Inc., formerly known as Bacterin International Holdings, Inc., is based in Belgrade, United States.
Number of Employees: 151 |
|
|
| |
| • Price / Volume Information |
| Yesterday's Closing Price: $0.48 |
Daily Weekly Monthly
 |
| 20 Day Moving Average: 158,804 shares |
| Shares Outstanding: 140.26 (millions) |
| Market Capitalization: $67.33 (millions) |
| Beta: -0.11 |
| 52 Week High: $0.95 |
| 52 Week Low: $0.44 |
| Short Interest Ratio: |
| |
% Price Change |
% Price Change Relative to S&P 500 |
| 4 Week |
-5.81% |
-10.41% |
| 12 Week |
-16.98% |
-23.26% |
| Year To Date |
-38.78% |
-44.87% |
|
|
|
|
| |
|
|
| |
| • General Corporate Information |
Officers
Sean E. Browne - President and Chief Executive Officer
Stavros G. Vizirgianakis - Chairman of the Board and Director
Mark A. Schallenberger - Chief Operating Officer
Scott C. Neils - Chief Financial Officer and Assistant Secretary
John K. Bakewell - Director
|
|
Peer Information
Xtant Medical Holdings, Inc. (ABMD)
Xtant Medical Holdings, Inc. (DMDS)
Xtant Medical Holdings, Inc. (CPWY.)
Xtant Medical Holdings, Inc. (EQUR)
Xtant Medical Holdings, Inc. (ECIA)
Xtant Medical Holdings, Inc. (FMS)
|
|
Industry / Sector / Ticker Info
Analyst Coverage: No
Industry Group: MED INSTRUMENTS
Sector: Medical
CUSIP: 98420P308
SIC: 3841
|
|
Fiscal Year
Fiscal Year End: December
Last Reported Quarter: 03/01/26
Next Expected EPS Date: 08/11/26
|
|
Share - Related Items
Shares Outstanding: 140.26
Most Recent Split Date: 2.00 (0.08:1)
Beta: -0.11
Market Capitalization: $67.33 (millions)
|
|
|
|
|
| |
| • EPS Information |
• Dividend Information |
| Analyst Coverage: No |
Dividend Yield: 0.00% |
| Current Fiscal Quarter EPS Consensus Estimate: $ |
Indicated Annual Dividend: $0.00 |
| Current Fiscal Year EPS Consensus Estimate: $ |
Payout Ratio: 0.00 |
| Number of Estimates in the Fiscal Year Consensus: |
Change In Payout Ratio: |
| Estmated Long-Term EPS Growth Rate: % |
Last Dividend Paid: NA - $0.00 |
| Next EPS Report Date: 08/11/26 |
|
|
|
| |