| Zacks Company Profile for Yellow Corporation (YELLQ : OTC) |
|
|
| |
| • Company Description |
| Yellow Corporation provides comprehensive logistics and less-than-truckload networks in North America with local, regional, national and international. The company offers industry expertise in flexible supply chain solutions, ensuring customers can ship industrial, commercial and retail goods. It is the holding company for a portfolio of LTL brands including Holland, New Penn, Reddaway and YRC Freight, as well as the logistics company HNRY Logistics. Yellow Corporation, formerly known as YRC Worldwide Inc., is headquarted in OVERLAND PARK, Kan.
Number of Employees: |
|
|
| |
| • Price / Volume Information |
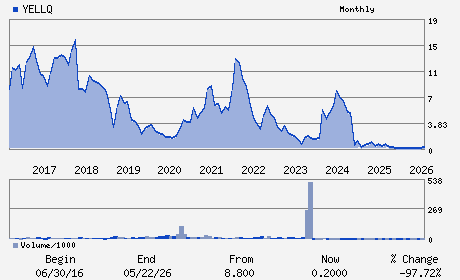
| Yesterday's Closing Price: $0.20 |
Daily Weekly Monthly
 |
| 20 Day Moving Average: 117,596 shares |
| Shares Outstanding: 52.58 (millions) |
| Market Capitalization: $10.52 (millions) |
| Beta: 462.73 |
| 52 Week High: $0.80 |
| 52 Week Low: $0.00 |
| Short Interest Ratio: |
| |
% Price Change |
% Price Change Relative to S&P 500 |
| 4 Week |
49,900.00% |
47,457.56% |
| 12 Week |
300.00% |
269.78% |
| Year To Date |
900.00% |
819.39% |
|
|
|
|
| |
|
|
| |
| • General Corporate Information |
Officers
Darren D. Hawkins - Chief Executive Officer and Director
Daniel L. Olivier - Chief Financial Officer
Susana Martinez - Director
David S. McClimon - Director
Chris T. Sultemeier - Director
|
|
Peer Information
- (-)
- (-)
- (-)
- (-)
- (-)
- (-)
|
|
Industry / Sector / Ticker Info
Analyst Coverage: No
Industry Group: TRANS-SERVICES
Sector: Transportation
CUSIP: 985510106
SIC: 4213
|
|
Fiscal Year
Fiscal Year End: December
Last Reported Quarter: -
Next Expected EPS Date: -
|
|
Share - Related Items
Shares Outstanding: 52.58
Most Recent Split Date: 12.00 (0.00:1)
Beta: 462.73
Market Capitalization: $10.52 (millions)
|
|
|
|
|
| |
| • EPS Information |
• Dividend Information |
| Analyst Coverage: No |
Dividend Yield: 0.00% |
| Current Fiscal Quarter EPS Consensus Estimate: $ |
Indicated Annual Dividend: $0.00 |
| Current Fiscal Year EPS Consensus Estimate: $ |
Payout Ratio: |
| Number of Estimates in the Fiscal Year Consensus: |
Change In Payout Ratio: |
| Estmated Long-Term EPS Growth Rate: % |
Last Dividend Paid: NA - $0.00 |
| Next EPS Report Date: - |
|
|
|
| |